


 Early Days – The Beginning of DataSport
By Dennis E. ”Denny” Gebhard
For me the story starts in Coleraine in Itasca County in Northern Minnesota where, as youngster I learned to fish. I learned then that “You catch ‘em; you clean ’em.” Even in those days, I was always curious why it sometimes took so long to get fish to bite. Then, strangely, at certain odd times, they would magically turn on in a frenzy. Why?
Later in life, in an effort to try to explain this oddity in nature I began to clip the weekly Solunar ™ tables out of the newspaper and put them in my shirt pocket when I went into the woods or onto the water. I would try to remember to check the time of day that I caught fish to compare them with the Major and Minor periods in the charts. Quite often the tables did a pretty good job of matching the times of fishing action…. but not always. I wanted to learn more so I bought and read the book “Moon Up – Moon Down” by John Alden Knight to try to understand the basis for the Solunar ™ tables. What I learned was that the Majors and Minors were based approximately on the times of high and low tides someplace in New York but more specifically they were based on the forces that caused the tides. That intrigued me.
This was way back in the late 1960’s and early 70’s, in the early days of computers, and I was working as a computer programmer and manager. My group had the responsibility to write programs to test and debug the then-large computers that EMR Computer Division of Univac manufactured for seismic data processing and other scientific research. In those days there was no Internet, so if you wanted a computer to do something you had to write a program to do it. And the numeric test programs from my group gave the new computers a real challenge.
As the story goes I took my young family on a week-long fishing trip to North Star Lake north of Coleraine. And it rained every day. Not so good for family fishing, but on this particular trip I took along a book published by the government which described how the mechanical tide predicting machine actually generated the tide forecasts for the Naval Observatory. The book was loaded with formulas and since the rainy weather made us cabin bound I took the time to code up the 300+ formulas in Fortran to generate tide tables.
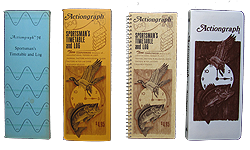
When we returned home, I showed my fishing buddy and co-worker Don Lomax what I had and together we got the program running as a test sequence for the mathematics processor on the EMR computers we were debugging. By incorporating a digital plotter into the test we could generate our own version of the Sun/Moon Tide charts. Right away we noticed some similarities to the Solunar ™ Majors and Minors but due to the dramatic differences in the magnitude and duration of the tide forces throughout the lunar month and year we thought we had a better explanation for the widely varying peak action periods. Indeed due to differing tide forces, the majors were sometimes three hours long and sometimes only a half hour long, primarily based on moon phases. And now we had a good potential business-related excuse to fish and fish and fish some more. When we were satisfied that we in fact were working with a dramatic improvement over other forecasts, we decided to publish our tables to give them more exposure and allow others to use them around the country. In 1974 we published the first Actiongraph Fish and Game Forecaster and we named our company DataSport,Inc. The publishing became a nice side business for us, but introduction to local television news made the product into a full time business. We were indeed on the map for a successful syndication business, but we never stopped testing and improving.
In the mean time we set about to test improvements and format changes in our annual publications. In about 1979, through the cooperation of Dennis Anderson, the renowned outdoor writer, we were given access to 7 years of contest entries from the annual St. Paul Pioneer Press Fishing Contest™. We keyed-in all of the entry forms into our computer with each entry containing every detail of every catch. Then we statistically analyzed the results and while we didn’t honestly know what to expect, they showed a high statistical correlation between our forecasts and the many thousands of times-of-day for each fish entered in the contest. And the results also showed an even higher correlation to the larger fish of each species.
The confirmation was gratifying but it hasn’t stopped there. We are still working on improvements. And down through the years we’ve had imitators. To the imitators I say “Thanks to you.” As Charles Caleb Colton once said “imitation is the sincerest form of flattery,” and we are flattered that so many folks like our contributions enough to design their information specifically around ours. That’s why we call ours “The Original Fish and Game Forecaster™”. We are the only ones that can name it that way.
It has been a long forty-year journey and throughout, we’ve tried to run a consistently accurate, top quality product to improve the fishing and wildlife observational skills of its many, many thousands of users.
And me, I’m still testing whenever I get the chance — ice fishing on Lake of the Woods, bass fishing on Lake Minnetonka, salmon fishing on Lake Michigan, watching my bird feeders and salt water fishing in Florida. I know when to catch ‘em and see ‘em and I hope you do too.
And thanks for the opportunity to tell my story.